Oct 5, 2024
GABAergic amacrine cells balance biased chromatic information in the mouse retina
Korympidou MM*, Strauss S*, Schubert T, Franke K, Berens P, Euler T#, Vlasits AL#
Cell Reports accepted (for preprint, see 10.1101/2024.03.08.58406).
Downloads
All original code has been deposited at github.com/eulerlab/amacrinecolor and is publicly available at zenodo.13893981 as of the date of publication.
Feb 17, 2023
Birds multiplex spectral and temporal visual information via retinal On- and Off-channels
Seifert M§, Roberts PA, Kafetzis G, Osorio D§, Baden T$
BioRxiv 10.1101/2022.10.20.513047.
Downloads
Feb 17, 2023
Amacrine cells differentially balance zebrafish colour circuits in the central and peripheral retina
Wang X§, Roberts PA, Yoshimatsu T, Lagnado L*§, Baden T*$
Cell reports 42:112055
Downloads
August 5, 2022
Center-surround interactions underlie bipolar cell motion sensitivity in the mouse retina
Strauss S*, Korympidou MM*, Ran Y, Franke K, Schubert S, Baden T, Berens P, Euler T#, Vlasits AL#
Nature Communications, coming soon.
Downloads
Sept 9, 2021
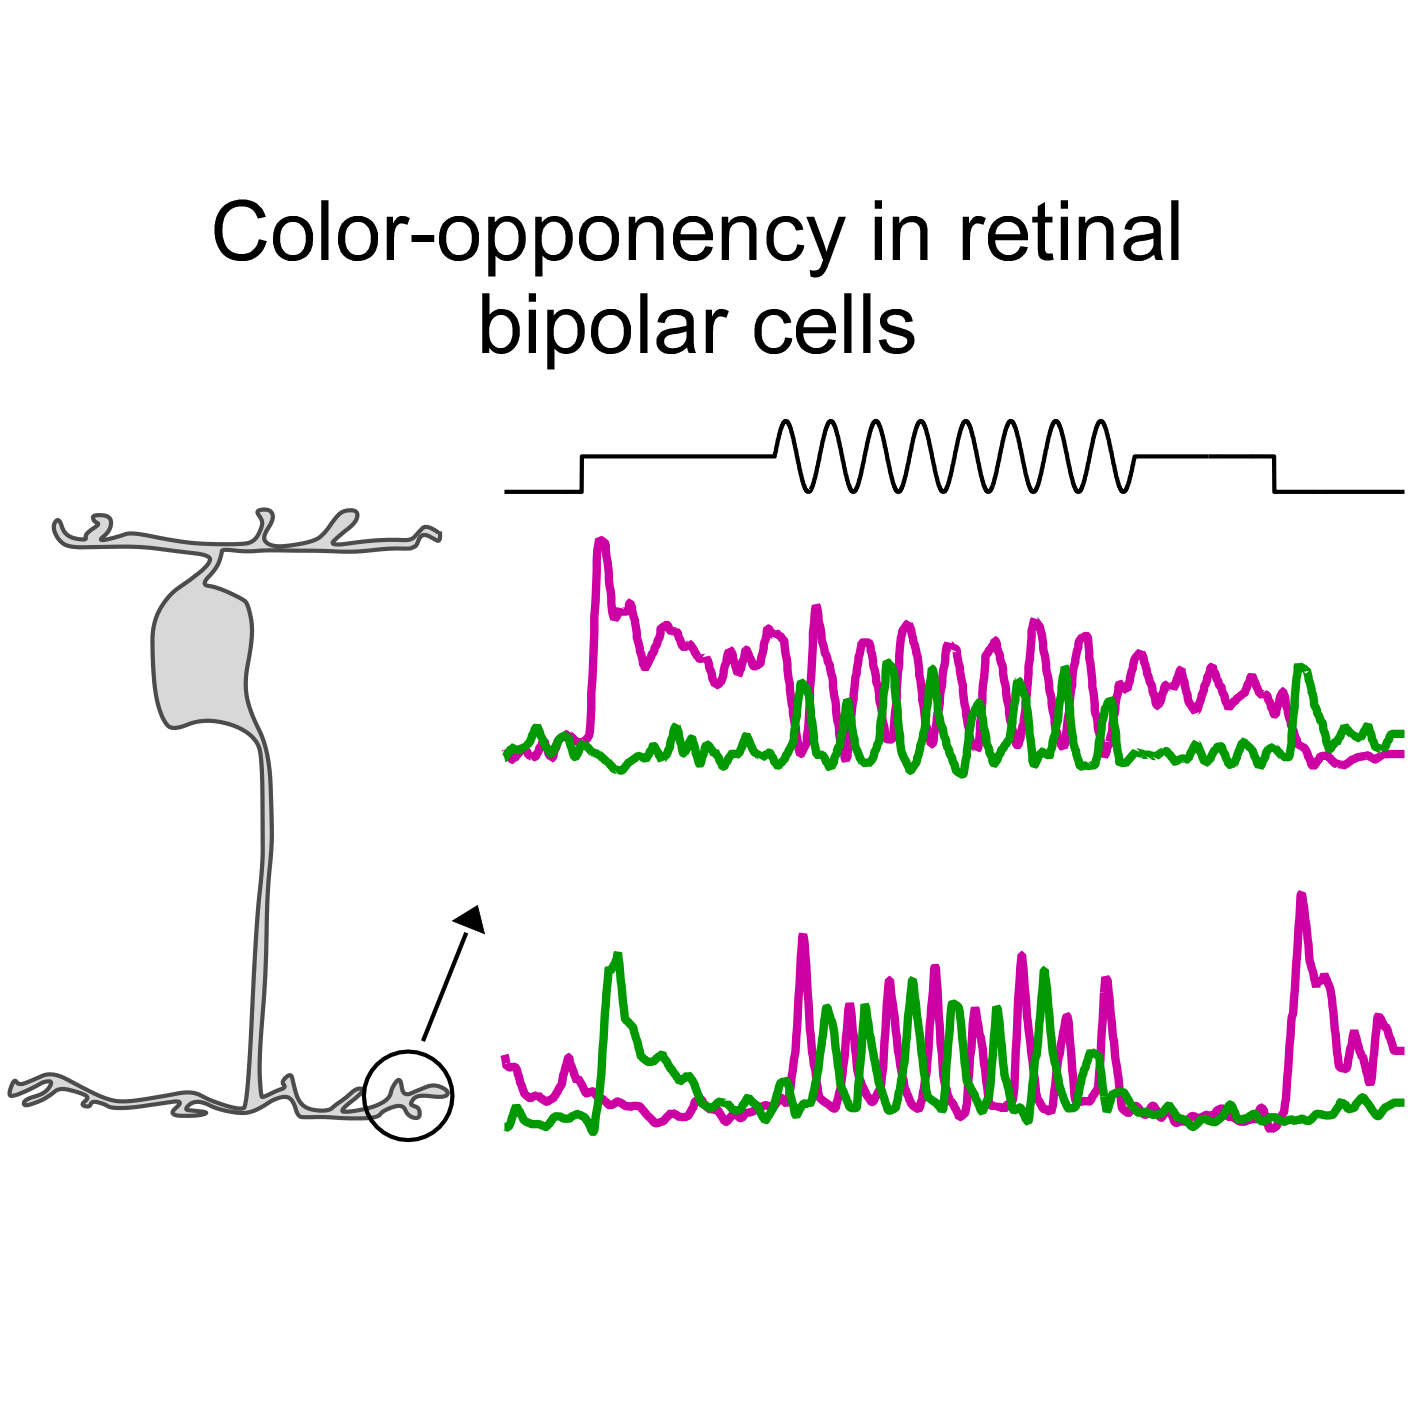
Spectral Inference reveals principal cone-integration rules of the zebrafish inner retina.
Bartel P, Yoshimatsu T, Janiak FK, Baden T$
Current Biology 31 1-13
Downloads
July 17, 2021
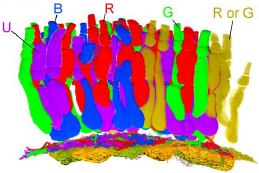
Ancestral circuits for vertebrate colour vision emerge at the first retinal synapse
Yoshimatsu T, Bartel P, Schroeder C, Janiak FK, St-Pierre F, Berens P, Baden T$
Science Advances 7(24):eabj6815
Downloads
July 17, 2021
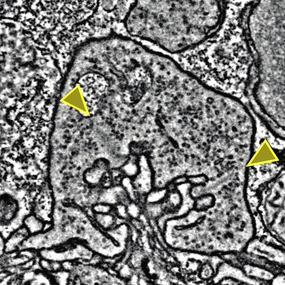
Distinct Synaptic Transfer Functions in Same-Type Photoreceptors
Schroeder C, Oesterle J, Berens P*, Yoshimatsu T*, Baden T*$
eLife 2021; 10:e67851.
Downloads
January 1, 2021
Colourfulness as a possible measure of object proximity in the larval zebrafish brain
Bartel P, Janiak FK, Osorio D, Baden T$
Current Biology 31(5): R235-6.
Downloads
April 7, 2020
Neural circuits in the mouse retina support color vision in the upper visual field
Szatko KP#, Korympidou MM#, Ran Y, Berens P, Dalkara D, Schubert S, Euler T, Franke K*
BioRxiv 10.1101/745539.
#These authors contributed equally to this work;
*Senior author and correspondence
Downloads

February 12, 2020
Type-specific dendritic integration in mouse retinal ganglion cells
Yanli Ran1,2,7, Ziwei Huang1,2,7, Tom Baden1,4, Timm Schubert1,2, Harald Baayen5, Philipp Berens1-3,6,#, Katrin Franke1-3,#, Thomas Euler1-3,#,*
Nature Communications, accepted.
7These authors contributed equally to this work; #Senior authors, *Correspondence
Downloads
- Custom scripts in Python, R and Igor for data processing, statistics analysis and plotting
- Code for receptive field estimation
- Relevant data
February 1, 2020
What the Zebrafish’s Eye tells the Zebrafish’s Brain: Retinal Ganglion Cells for Prey Capture and Colour Vision.
Mingyi Zhou*, John Bear*, Paul A Roberts, Filip K Janiak, Julie Semmelhack, Takeshi Yoshimatsu, Tom Baden$
Current Biology 30, 2927-2942.
*authors contributed equally, $correspondence
Downloads
September 18, 2019
Fovea-like Photoreceptor Specializations Underlie Single UV-Cone Driven Prey Capture Behaviour in Zebrafish
Takeshi Yoshimatsu$, Cornelius Schroeder, Noora E Nevala, Philipp Berens, Tom Baden$
Neuron (107):1-18
$correspondence
Downloads
January 17, 2019
Mouse dLGN receives functional input from a diverse population of retinal ganglion cells with limited convergence.
Miroslav Román Rosón*, Yannik Bauer*, Ann H. Kotkat, Philipp Berens#, Thomas Euler#, Laura Busse# (2019)
Neuron 10.1016/j.neuron.2019.01.040.
*authors contributed equally, #co-senior authors
Downloads
- N/A
April 21, 2018
Zebrafish differentially process colour across visual space to match natural scenes.
Zimmermann MJY*, Nevala NE*, Yoshimatsu T*, Osorio D, Nilsson DE, Berens P, Baden T (2018)
Current Biology 28(1-15)..
*authors contributed equally
Downloads
- 2-photon data
- Natural imaging data
Note: this data set is linked to a method paper describing the hyperspectral scanning approach in more detail which currently in preparation (Nevala and Baden, in prep.). The database contains all scans used in the Current Biology paper, but in addition comprises scans from other (terrestrial) scenes. The method paper will be uploaded to bioRxiv shortly. In addition, Supplementary Data S1 from the Current Biology paper summaries all underwater scans used in this paper.
March 21, 2018
A Tale of Two Retinal Domains: Near Optimal Sampling of Achromatic Contrasts in Natural Scenes Through Asymmetric Photoreceptor Distribution.
Baden T*, Schubert T*, Chang L, Wei T, Zaichuk M, Wissinger B, Euler T (2013)
Neuron 80(5):1206-1217,
10.1016/j.neuron.2013.09.030.
*authors contributed equally
The corresponding dataset contains spectral image data of an early spring daytime forest scene recorded using a ‘‘hyperspectral scanner’’. For details, see publication.
Downloads
- 10.5281/zenodo.1204501 (dataset on Zenodo)
- github.com/eulerlab/published_data (basic visualisation routines in python; as jupyter notebooks w/ instructions)
November 23, 2017
Local signals in mouse horizontal cell dendrites
Chapot CA, Behrens C, Rogerson LE, Baden T, Pop S, Berens P, Euler T#, Schubert T# (2017).
Local signals in mouse horizontal cell dendrites.
Curr Biol 10.1016/j.cub.2017.10.050.
#corresponding authors
Downloads
- github.com/eulerlab/published_data (horizontal model; as jupyter notebooks w/ instructions)
January 21, 2017
Inhibition decorrelates visual feature representations in the inner retina
Franke K*, Berens P*, Schubert T, Bethge M, Euler T#, Baden T# (2017).
Inhibition decorrelates visual feature representations in the inner retina.
Nature 10.1038/nature21394.
*authors contributed equally, #corresponding authors
The corresponding dataset contains light-evoked bipolar cell signals from 13,311 regions-of-interest (ROIs, corresponding to individual axon terminals) recorded from the mouse retina. The data were obtained by two-photon glutamate imaging employing the genetically-encoded glutamate sensor iGluSFR and a standardized set of stimuli (see publication for details).
Downloads
- 10.5061/dryad.rs2qp (dataset on datadryad.org)
- Franke_et_al_2017_visualization (basic visualisation routines in MatLab)
- Datajoint schema used for data handling
Brief instructions
- Download the dataset (10.5061/dryad.rs2qp) from datadryad.org
- Run script.

January 21, 2016
The functional diversity of retinal ganglion cells in the mouse
Baden T*, Berens P*, Franke K*, Román Rosón M, Bethge M, & Euler T# (2016).
The functional diversity of retinal ganglion cells in the mouse.
Nature 10.1038/nature16468.
*authors contributed equally, #corresponding author
The corresponding dataset contains recordings of 11,210 retinal ganglion cells from the mouse retina obtained by two-photon calcium imaging with the synthetic calcium indicator OGB-1 to a standardized set of stimuli (see publication for details). In addition, the dataset contains morphological, genetic and immunohistochemical metadata, where available.
Downloads
- doi:10.5061/dryad.d9v38 (dataset on datadryad.org)
- Baden_et_al_2016_visualization (basic visualisation routines in MatLab)
Brief instructions
- Download the dataset (doi:10.5061/dryad.d9v38) from datadryad.org
- Load the data into MATLAB using:
data = load(‘filename.mat’); - Call plotOverview(data) to create an overview plot over all groups and plotStamp(data,5) to create an overview for a single group (here, for example, group 5).